If you've read my earlier post on A2A, you know I run a two-machine agent setup at home. Nix on the NAS, Max on the Mac Mini. They delegate to each other, spawn sub-agents, call tools, hit LLMs. The whole thing runs while I take a backseat.
At some point I started wondering: what's actually happening in there?
Which model ran for that response? When one agent delegated to another, did it spawn something else? That spike in API usage last week, which agent caused it, and what was it doing?
I had no good answer. I could read logs. But logs don't show you the chain.
#The Problem With Logs
Logging is fine for single-process applications. You print something, it shows up, you read it. The problem with multi-agent systems is that a single user request fans out across multiple processes, machines, and models. By the time a response comes back, five things have happened on three different machines, and the log files are all separate.
What I wanted was this:
user_message (root)
  ├── tool: exec(ssh mac-mini)       2.1s
  ├── tool: recall_search            0.3s
  └── llm: claude-sonnet-4-6        8.3s   $0.023
        └── a2a: max-v1             4.1s
              ├── llm: gemini-2.0-flash   3.8s   $0.004
              └── tool: browser_control   1.4s
A coherent picture of the decision chain, with cost and latency at every hop. Not a dashboard someone else designed for a different use case, but something that understands the provenance of every event.
#Why OpenTelemetry
Custom telemetry formats require a custom backend, custom SDKs, and custom dashboards. Every new language or framework means more work. You'd be building the telemetry infrastructure instead of the thing you actually care about.
OpenTelemetry is vendor-neutral, widely supported, and already understood by the infrastructure most people run. Grafana Tempo for trace storage, Prometheus for metrics, Grafana for dashboards. None of this is new infrastructure, it's what you'd run anyway.
The only missing piece was a semantic convention for agent behavior. OTel has conventions for databases, HTTP, messaging. It doesn't have one for "this LLM call was made by agent X as part of session Y which was delegated from agent Z." That's a provenance problem.
#W3C PROV-O for Agent Provenance
W3C PROV-O is an ontology for data provenance. It defines a vocabulary for expressing who did what, when, and why, with formal relationships between entities, activities, and agents. It was designed for scientific data lineage, but the model maps well onto agent behavior.
Every span in AgentWeave carries a set of prov.* attributes:
prov.agent.id         = "nix-v1"           # which agent ran this
prov.agent.type       = "main"             # main, subagent, delegated
prov.session.id       = "nix-main-abc123"  # which session
prov.parent.session.id = "max-main-xyz"    # who delegated to us
prov.task.label       = "summarize inbox"  # what were we doing
prov.project          = "agentweave"       # which project
This gives you something logs can't: a traversable provenance graph. You can ask "show me every LLM call made as part of this session, including all sub-agents" and get a coherent answer.
#Three Ways to Instrument
I wanted AgentWeave to work regardless of how an agent is built. Three paths:
SDK decorators — if you own the agent code, wrap your functions:
from agentweave import trace_agent, trace_llm, trace_tool

@trace_agent(name="nix", session_id="nix-main-abc")
def run_session(task: str):
    result = call_llm(task)
    return result

@trace_llm(provider="anthropic", model="claude-sonnet-4-6")
def call_llm(messages):
    return client.messages.create(...)
Auto-instrumentation — one line patches the Anthropic and OpenAI SDKs globally:
import agentweave
agentweave.auto_instrument()
# All subsequent anthropic.Anthropic() calls are now traced
Proxy — point your ANTHROPIC_BASE_URL at AgentWeave's proxy and get traces with zero code changes:
ANTHROPIC_BASE_URL=http://localhost:4317/v1 \
AGENTWEAVE_SESSION_ID=my-session \
claude --dangerously-skip-permissions "your task"
The proxy needs to be fully transparent: pass through auth headers, forward the response unchanged, and only extract what it needs for tracing. For OAuth tokens (like the ones the Claude CLI uses), that means pure passthrough with no modification. An early version broke authentication by injecting an extra API key header. Worth knowing if you're building something similar.
#Cross-Agent Tracing via W3C TraceContext
The hardest part was linking traces across agents on different machines. When Nix delegates a task to Max via A2A, you want Max's spans to appear as children of Nix's root span in Grafana Explore.
W3C TraceContext solves this. The traceparent header carries a trace ID and parent span ID that any OTel-aware system can use to link spans across process boundaries.
AgentWeave's propagation helpers handle this:
from agentweave.propagation import inject_trace_context, extract_trace_context

# Caller side (Nix): inject into outgoing A2A request headers
headers = inject_trace_context({})
response = requests.post(max_a2a_url, headers=headers, json=task)

# Receiver side (Max): extract from incoming headers
ctx = extract_trace_context(request.headers)
with tracer.start_as_current_span("max-handler", context=ctx):
    # spans started here are children of Nix's root span
    ...
When this works, Grafana Explore shows the full Nix to Max delegation as a connected waterfall. One trace ID, spans from two machines.
#What the Dashboard Shows
The dashboard is not the primary focus of AgentWeave. The observability layer (the SDK, the proxy, the span schema, the propagation) is the core. The dashboard is a convenience on top, useful for visualizing what's flowing through the system without writing TraceQL queries by hand. If you already have a Grafana setup, just point it at your Tempo instance and skip the dashboard entirely.
That said, it's a useful starting point. It's a React SPA that queries Grafana Tempo directly via TraceQL with no intermediate API.
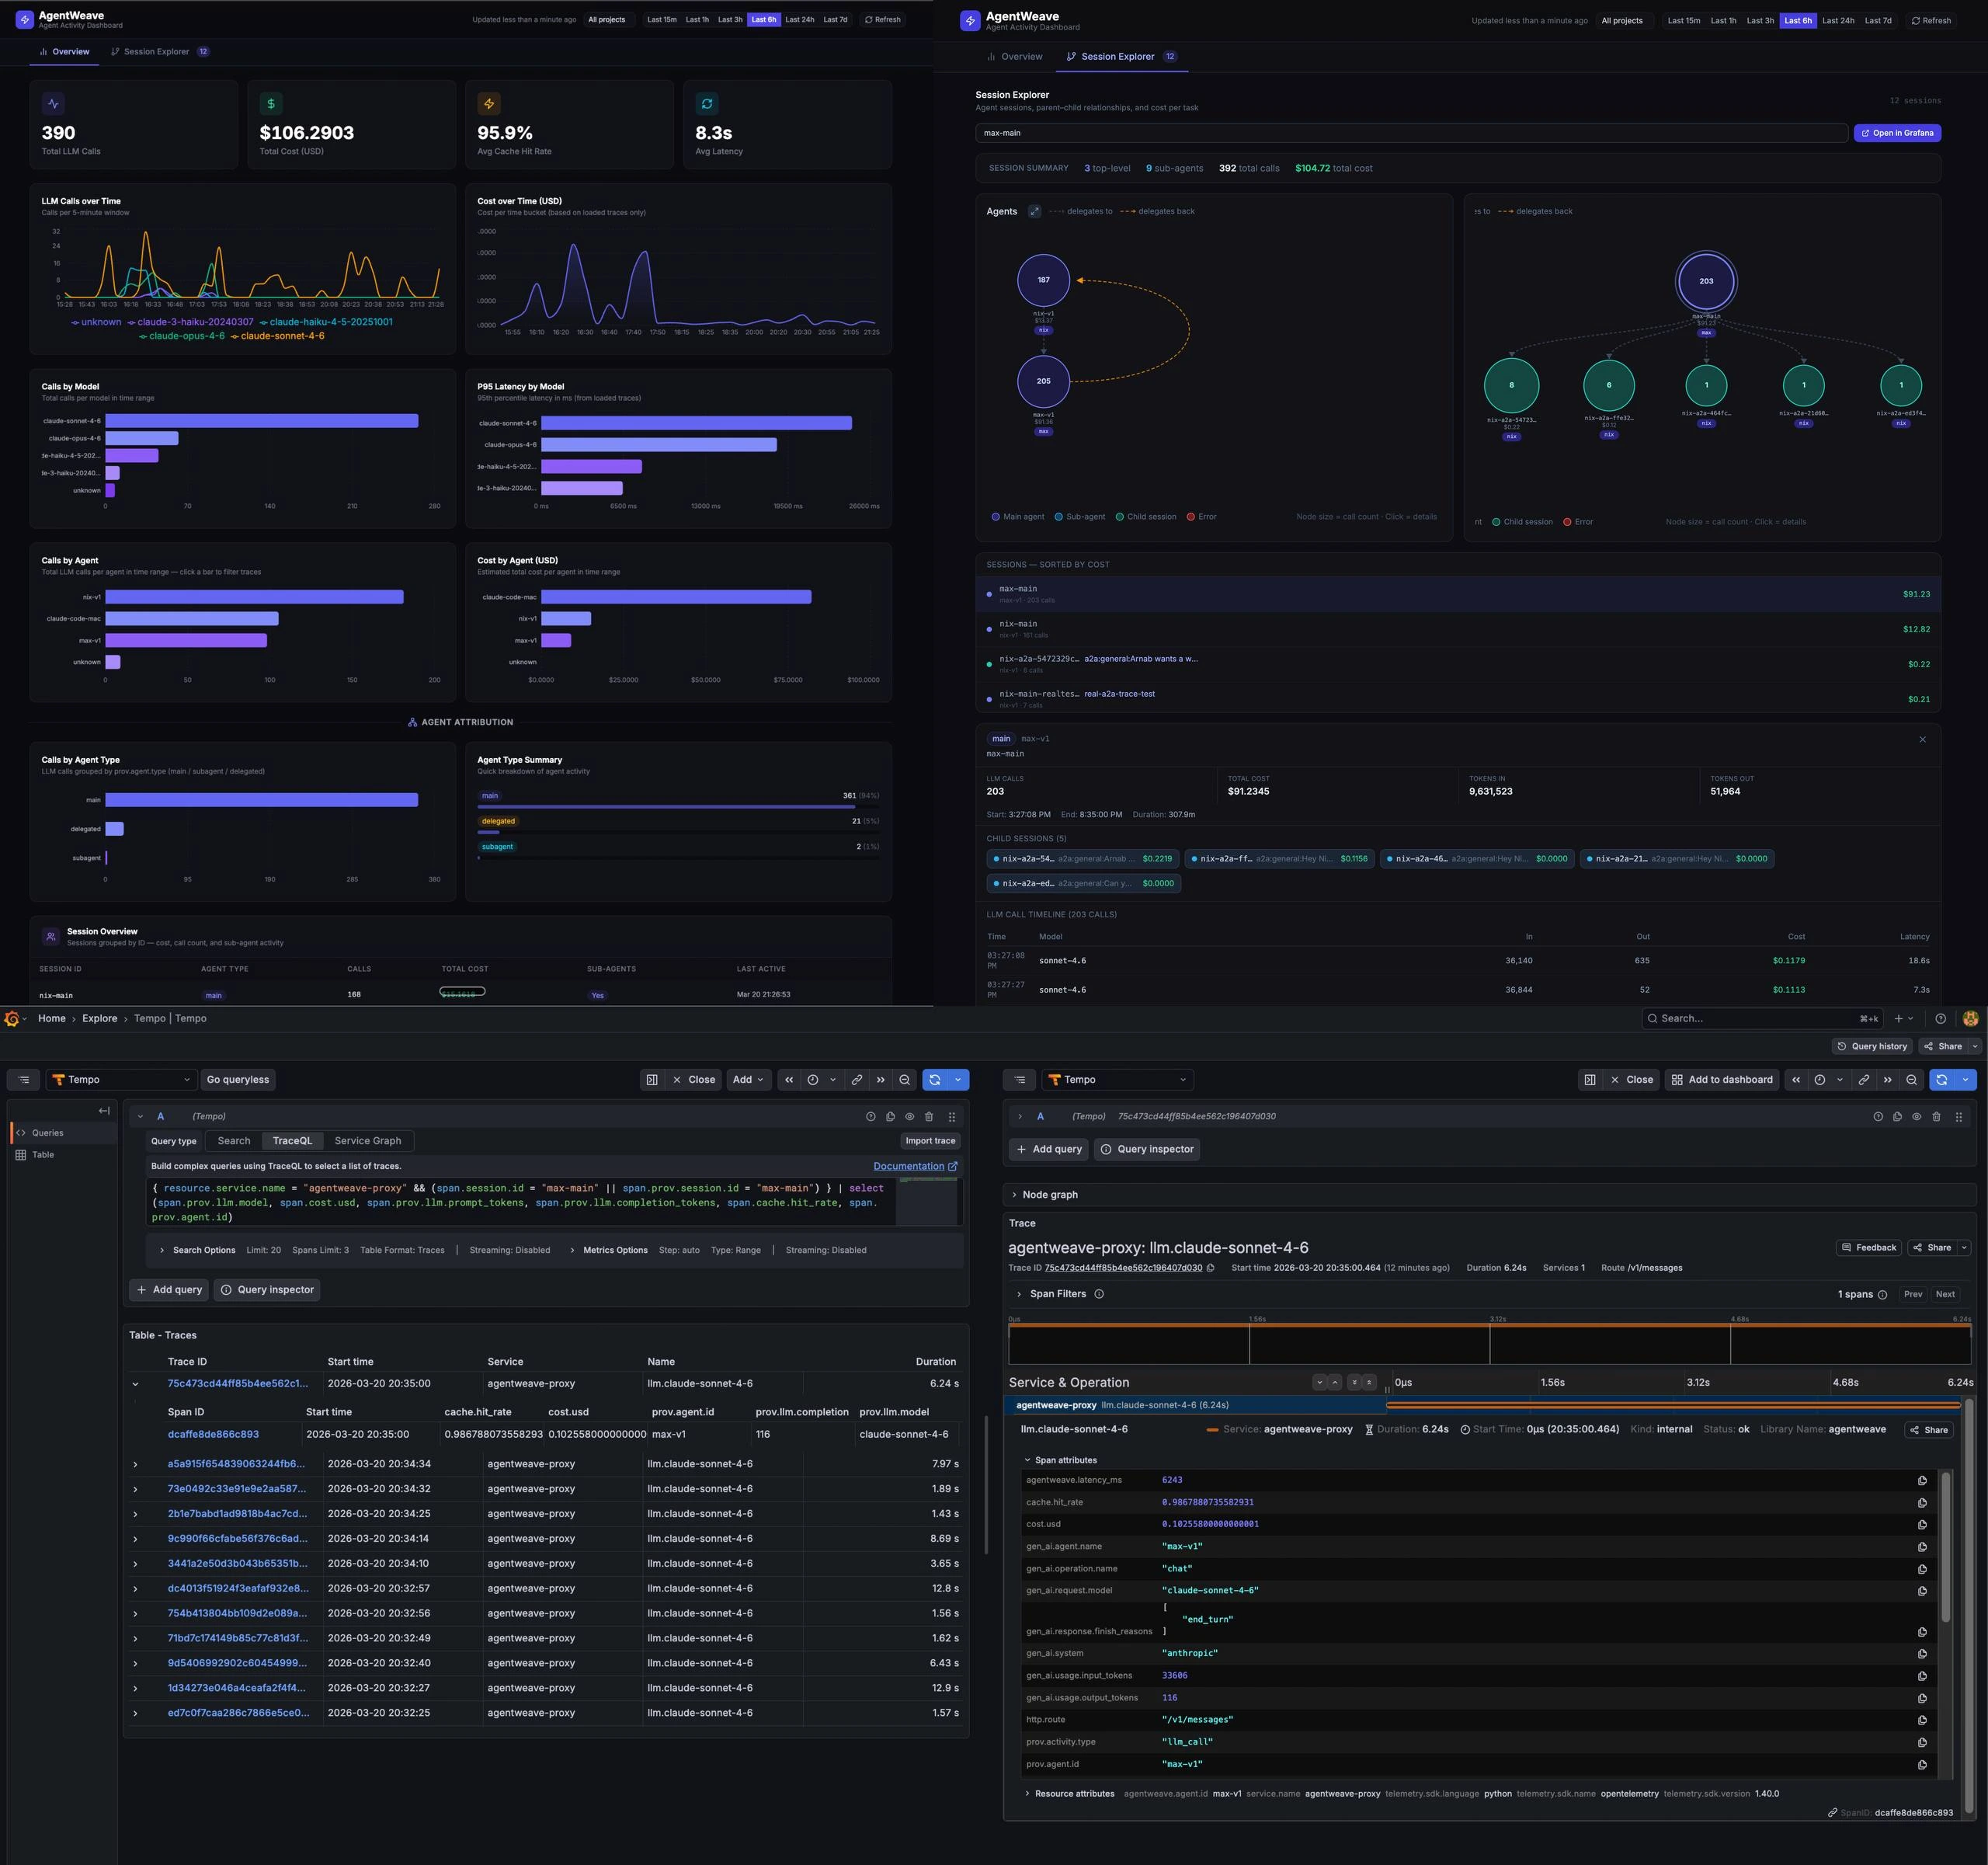
The Overview tab shows LLM calls over time, cost over time, P95 latency by model, cache hit rates, and cost by agent. Most panels are computed from raw trace data rather than Prometheus metrics, which makes them more accurate and removes the dependency on spanmetrics being healthy.
The Session Explorer renders the agent delegation graph: nodes for each session, edges for parent-child relationships. Click a node to see session detail, cost, call count, and a link to open the raw traces in Grafana Explore.
#Dogfooding
The most useful thing about this project is running it on the system it's designed to observe. Every conversation with my agents, every sub-agent spawn, every tool call flows through AgentWeave right now.
That creates a tight feedback loop. When a panel shows wrong data, I know immediately. When the session graph misses an edge, I see it on the next delegation. The project improves every day just by being used.
Some real numbers as of this writing: 398 LLM calls traced, $104 in API usage tracked, 96% cache hit rate across sessions. The cache hit rate surprised me. Anthropic's prompt caching is doing a lot of work, and I wouldn't have known without measuring it.
#What's Next
The most significant missing piece is session-level root spans. Right now each LLM call is an isolated span. What's missing is a root span per user message that becomes the parent of every tool call and LLM call within that turn. That requires host framework integration (OpenClaw in my case) to create the root span and inject traceparent into every downstream call.
The other item is evals: automated checks against captured traces to answer questions like "did this session complete the task?" or "did this model's latency regress?" The trace data makes it possible, that's a separate project.
The SDK supports Python, TypeScript, and Go. The proxy works with any OpenAI-compatible API. Everything is Apache 2.0.
If you're building multi-agent systems and thinking about observability, the repo is at github.com/arniesaha/agentweave. I'd love to hear what you're running into.